NSX-T Manager: Some Appliance Components Are Not Functioning Properly

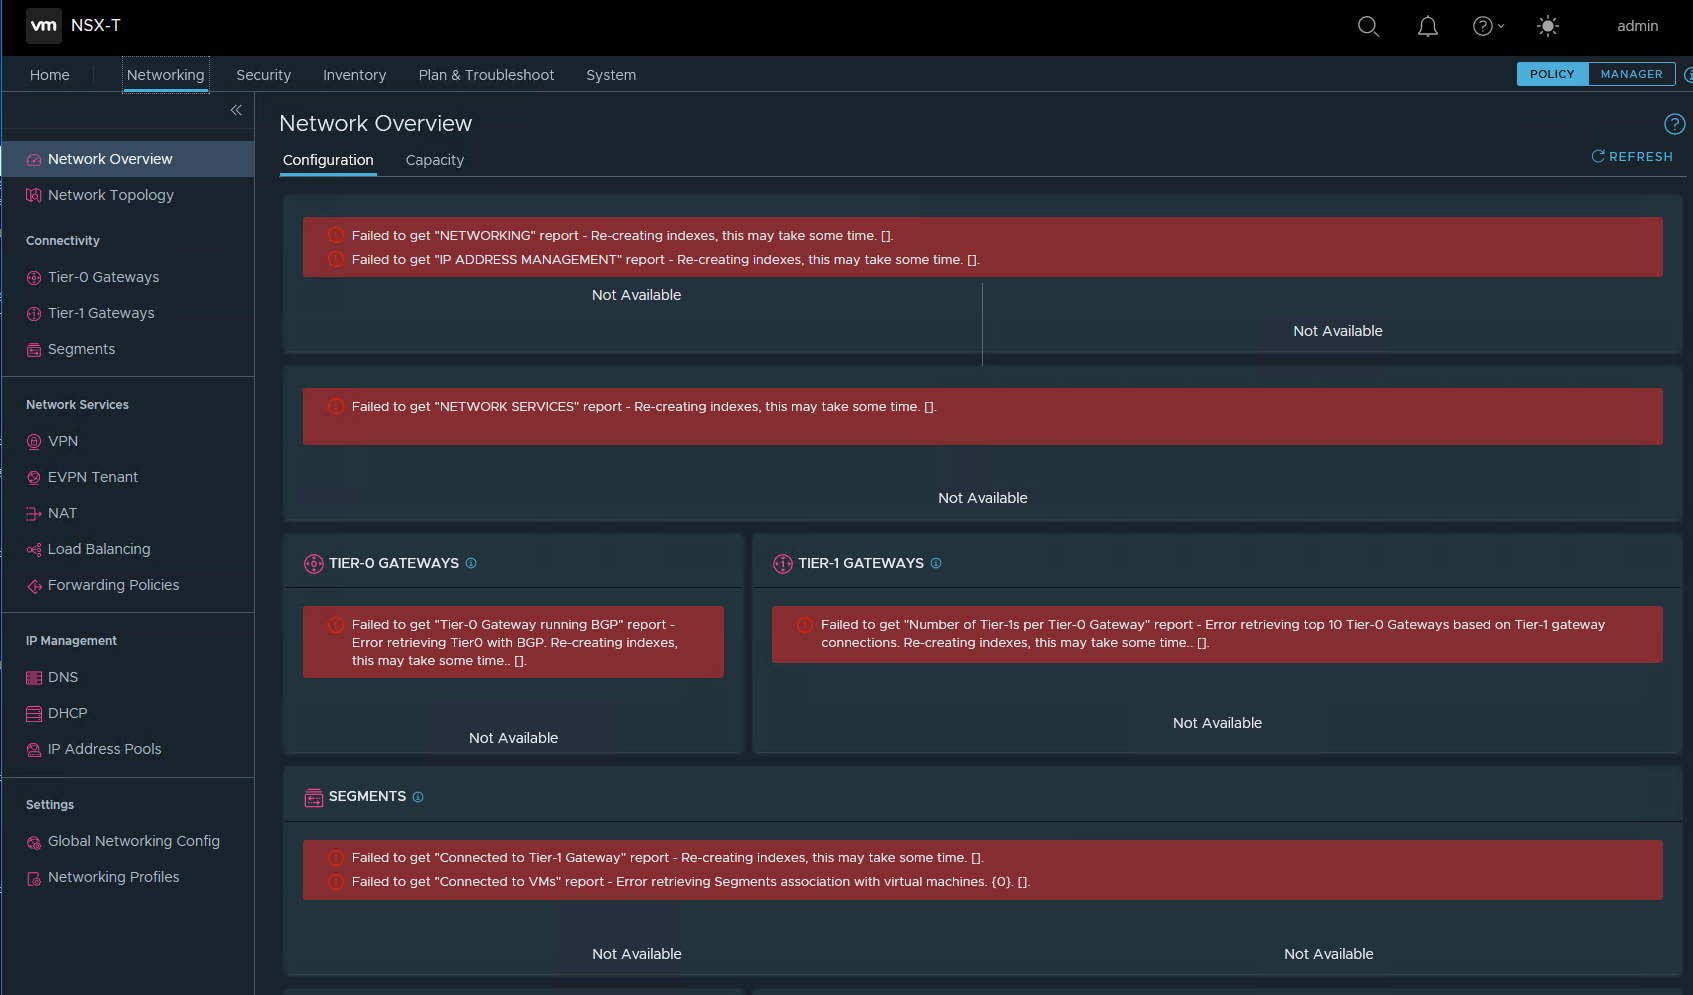
When browsing to the NSX-T Manager (3.1.3.x) interface, I see:
1Some appliance components are not functioning properly.
2Component health: MANAGER:UNKNOWN, SEARCH:UP, POLICY:UP, UI:UP, NODE_MGMT:UP.
3Error code: 101
Usually this can show up if the NSX-T Manager is booting up and some services haven't come up yet, but this one has been powered on for several hours.
SSH to the NSX-T Manager as admin. There's some services not up:
 1nsxm2> get cluster status
 2Thu Aug 04 2022 AEST 14:54:34.340
 3Cluster Id: b62acb8b-6080-4169-9adf-cb313ea7c2c1
 4Overall Status: DEGRADED
 5
 6Group Type: CONTROLLER
 7Group Status: UNAVAILABLE
 8
 9Members:
10    UUID                                       FQDN                                       IP               STATUS
11    68196cb9-0c81-4b93-ae4e-b21218f876d0       nsxm2.vmw.one                              172.30.10.12     DOWN
12
13Group Type: MANAGER
14Group Status: UNAVAILABLE
15
16Members:
17    UUID                                       FQDN                                       IP               STATUS
18    22490142-68d6-5330-f9b1-4fbb24adc9bb       nsxm2.vmw.one                              172.30.10.12     DOWN
19
20Group Type: HTTPS
21Group Status: UNAVAILABLE
22
23Members:
24    UUID                                       FQDN                                       IP               STATUS
25    22490142-68d6-5330-f9b1-4fbb24adc9bb       nsxm2.vmw.one                              172.30.10.12     DOWN
26
27Group Type: IDPS_REPORTING
28Group Status: UNAVAILABLE
29
30Members:
31    UUID                                       FQDN                                       IP               STATUS
32    22490142-68d6-5330-f9b1-4fbb24adc9bb       nsxm2.vmw.one                              172.30.10.12     DOWN
Do the usual troubleshooting checks: disk space, time, dns.
 1nsxm2> get filesystem-stats
 2Thu Aug 04 2022 AEST 15:06:24.708
 3Filesystem                   Size  Used Avail Use% Mounted on
 4udev                         7.9G     0  7.9G   0% /dev
 5tmpfs                        1.6G  6.2M  1.6G   1% /run
 6/dev/sda2                     11G  6.1G  3.7G  63% /
 7tmpfs                        7.9G  1.5M  7.9G   1% /dev/shm
 8tmpfs                        5.0M     0  5.0M   0% /run/lock
 9tmpfs                        7.9G     0  7.9G   0% /sys/fs/cgroup
10/dev/sda1                    944M  9.4M  870M   2% /boot
11/dev/sda3                     11G   41M  9.7G   1% /os_bak
12/dev/mapper/nsx-tmp          3.7G   20M  3.5G   1% /tmp
13/dev/mapper/nsx-var+dump     9.4G  704M  8.2G   8% /var/dump
14/dev/mapper/nsx-var+log       27G   10G   16G  39% /var/log
15/dev/mapper/nsx-config        29G  136M   28G   1% /config
16/dev/mapper/nsx-secondary     98G  1.2G   92G   2% /nonconfig
17/dev/mapper/nsx-image         42G   41G     0 100% /image
18/dev/mapper/nsx-config__bak   29G   45M   28G   1% /config_bak
19/dev/mapper/nsx-repository    31G  5.8G   24G  20% /repository
20tmpfs                        1.6G     0  1.6G   0% /run/user/1007
21tmpfs                        1.6G     0  1.6G   0% /run/user/10000
ah ha! /image is 100% full. At this point in time I'm not sure if this is the real problem, but it's something that should be fixed.
Looking at the logs, there's lots of errors because some services are not available. I think I already know it's a disk space thing, but I'm curious on if it's obvious from the logs.
1nsxm2> get log-file syslog
2
32022-08-04T04:58:02.678Z nsxm2.vmw.one NSX 17713 - [nsx@6876 comp="nsx-manager" subcomp="disk-monitor" username="root" level="INFO"] Acquired Lock on file, proceeding to check for disk usage
42022-08-04T04:58:02.730Z nsxm2.vmw.one NSX 17713 - [nsx@6876 comp="nsx-manager" subcomp="disk-monitor" username="root" level="INFO"]  message repeated 7 times: [Acquired Lock on file, proceeding to check for disk usage]
52022-08-04T04:58:02.736Z nsxm2.vmw.one NSX 17713 - [nsx@6876 comp="nsx-manager" subcomp="node-monitor" username="root" level="WARNING" eventId="vmwNSXPlatformSysImageDiskUsage"] {"event_sources": {"mount": "/image"}, "event_state": 100, "event_src_comp_id": "22490142-68d6-5330-f9b1-4fbb24adc9bb"}
That WARNING for /image seems to match up. Mental note: set up an alert in vRealize Log Insight for vmwNSXPlatformSysImageDiskUsage if it's not already there.
Lets check the filesystem:
 1nsxm2> st e
 2Password:
 3***************************************************************************
 4NOTICE TO USERS
 5
 6WARNING! Changes made to NSX Data Center while logged in as the root user
 7can cause system failure and potentially impact your network. Please be
 8advised that changes made to the system as the root user must only be made
 9under the guidance of VMware.
10***************************************************************************
11root@nsxm2:~# du -h --max-depth=1 /image/
1216K     /image/intelligence-upgrade-coordinator-tomcat
134.0K    /image/intelligence-upgrade-coordinator
1448K     /image/proton-tomcat
15100K    /image/vmware
1616K     /image/lost+found
174.0K    /image/policy-ui-patch
184.0K    /image/migration-coordinator
1912K     /image/cross-cloud-upgrade-coordinator-tomcat
2041G     /image/core
2116K     /image/upgrade-coordinator-tomcat
224.0K    /image/upgrade-coordinator
2341G     /image/
24
25root@nsxm2:~# du -h --max-depth=1 /image/core/
2641G     /image/core/
Narrowing down the folder. /image/core has filled the disk.
What's in there?
 1root@nsxm2:~# ls -laS /image/core |head
 2total 41444416
 3-rw-------  1 root root 842032583 Jul 29 22:15 java_pid16074.hprof
 4-rw-------  1 root root 842027558 Jul 31 05:45 java_pid27031.hprof
 5-rw-------  1 root root 842017738 Jul 30 10:45 java_pid23053.hprof
 6-rw-------  1 root root 841993348 Jul 30 10:00 java_pid25589.hprof
 7-rw-------  1 root root 841953280 Jul 31 16:30 java_pid29521.hprof
 8-rw-------  1 root root 841945088 Jul 31 11:45 java_pid5398.hprof
 9-rw-------  1 root root 841935878 Jul 30 02:45 java_pid31141.hprof
10-rw-------  1 root root 841929672 Jul 30 04:15 java_pid25469.hprof
11-rw-------  1 root root 841926397 Jul 30 15:45 java_pid25880.hprof
The /image/core/*.hprof files are created due to the compactor process continually going out of memory, each time is does this it creates a dump file (*.hprof) in the /image/core/ directory. Credit to VMware kb article below).
#YOLO!
 1root@nsxm2:/image/core# rm -rf *.hprof
 2
 3root@nsxm2:/image/core# df -h
 4Filesystem                   Size  Used Avail Use% Mounted on
 5udev                         7.9G     0  7.9G   0% /dev
 6tmpfs                        1.6G  6.2M  1.6G   1% /run
 7/dev/sda2                     11G  6.1G  3.7G  63% /
 8tmpfs                        7.9G  1.6M  7.9G   1% /dev/shm
 9tmpfs                        5.0M     0  5.0M   0% /run/lock
10tmpfs                        7.9G     0  7.9G   0% /sys/fs/cgroup
11/dev/sda1                    944M  9.4M  870M   2% /boot
12/dev/sda3                     11G   41M  9.7G   1% /os_bak
13/dev/mapper/nsx-tmp          3.7G   20M  3.5G   1% /tmp
14/dev/mapper/nsx-var+dump     9.4G  704M  8.2G   8% /var/dump
15/dev/mapper/nsx-var+log       27G  9.9G   16G  39% /var/log
16/dev/mapper/nsx-config        29G  165M   28G   1% /config
17/dev/mapper/nsx-secondary     98G  1.2G   92G   2% /nonconfig
18/dev/mapper/nsx-image         42G   53M   40G   1% /image
19/dev/mapper/nsx-config__bak   29G   45M   28G   1% /config_bak
20/dev/mapper/nsx-repository    31G  5.8G   24G  20% /repository
21tmpfs                        1.6G     0  1.6G   0% /run/user/1007
22tmpfs                        1.6G     0  1.6G   0% /run/user/10000
I've freed up 40GB. That should do it. Exit the filesystem, and reboot. We could just start the remaining services, but they probably need to be started in a specific order, so I'll just reboot it.
1root@nsxm2:/image/core# exit
2logout
3nsxm2>
4
5nsxm2> reboot
6Are you sure you want to reboot (yes/no): yes
7nsxm2>
After what seems like an eternity (in my lab, anyway), the UI finally comes up, and I can log in. But.. It's not quite right.
Going back in via SSH and checking cluster status, I can see some services are not up. Giving it another few minutes, I can see all the services are UP.
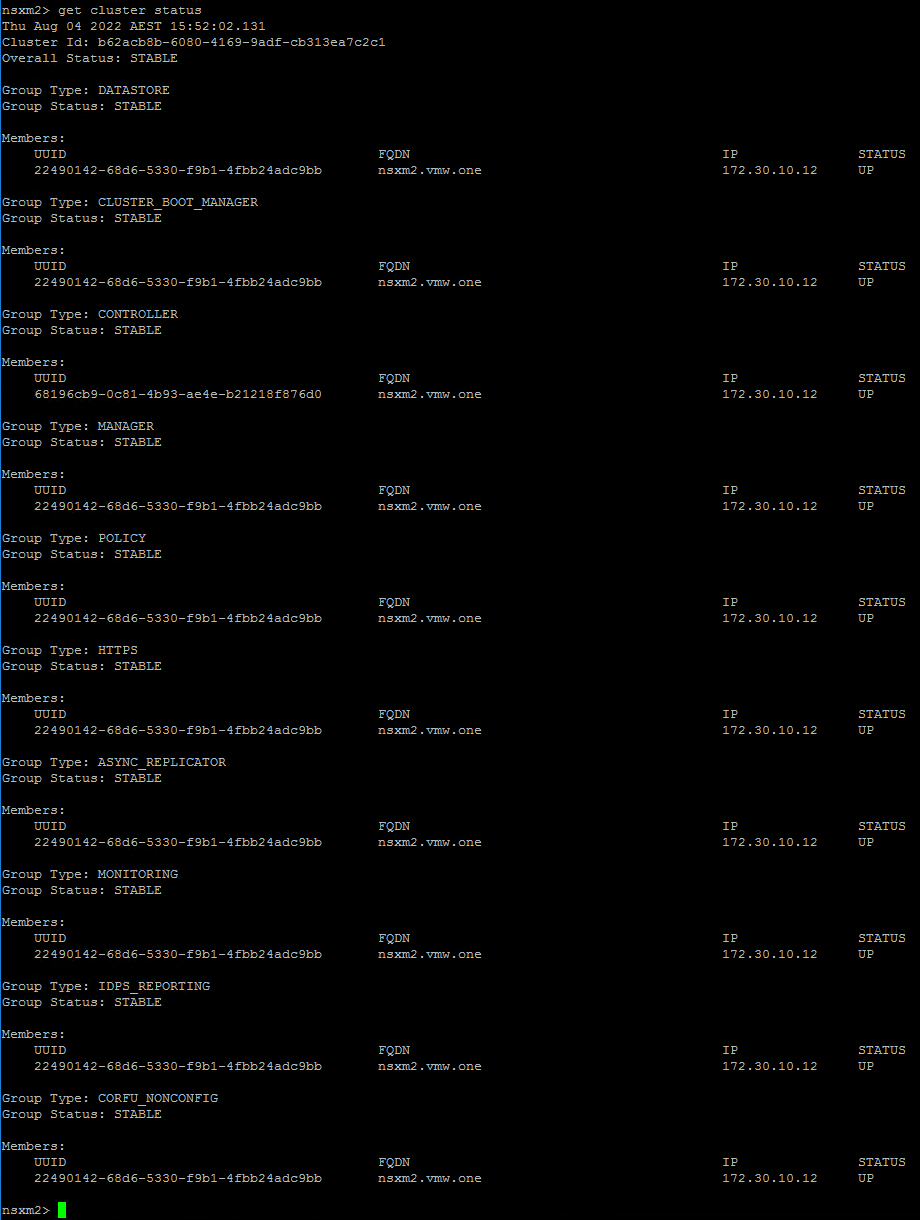
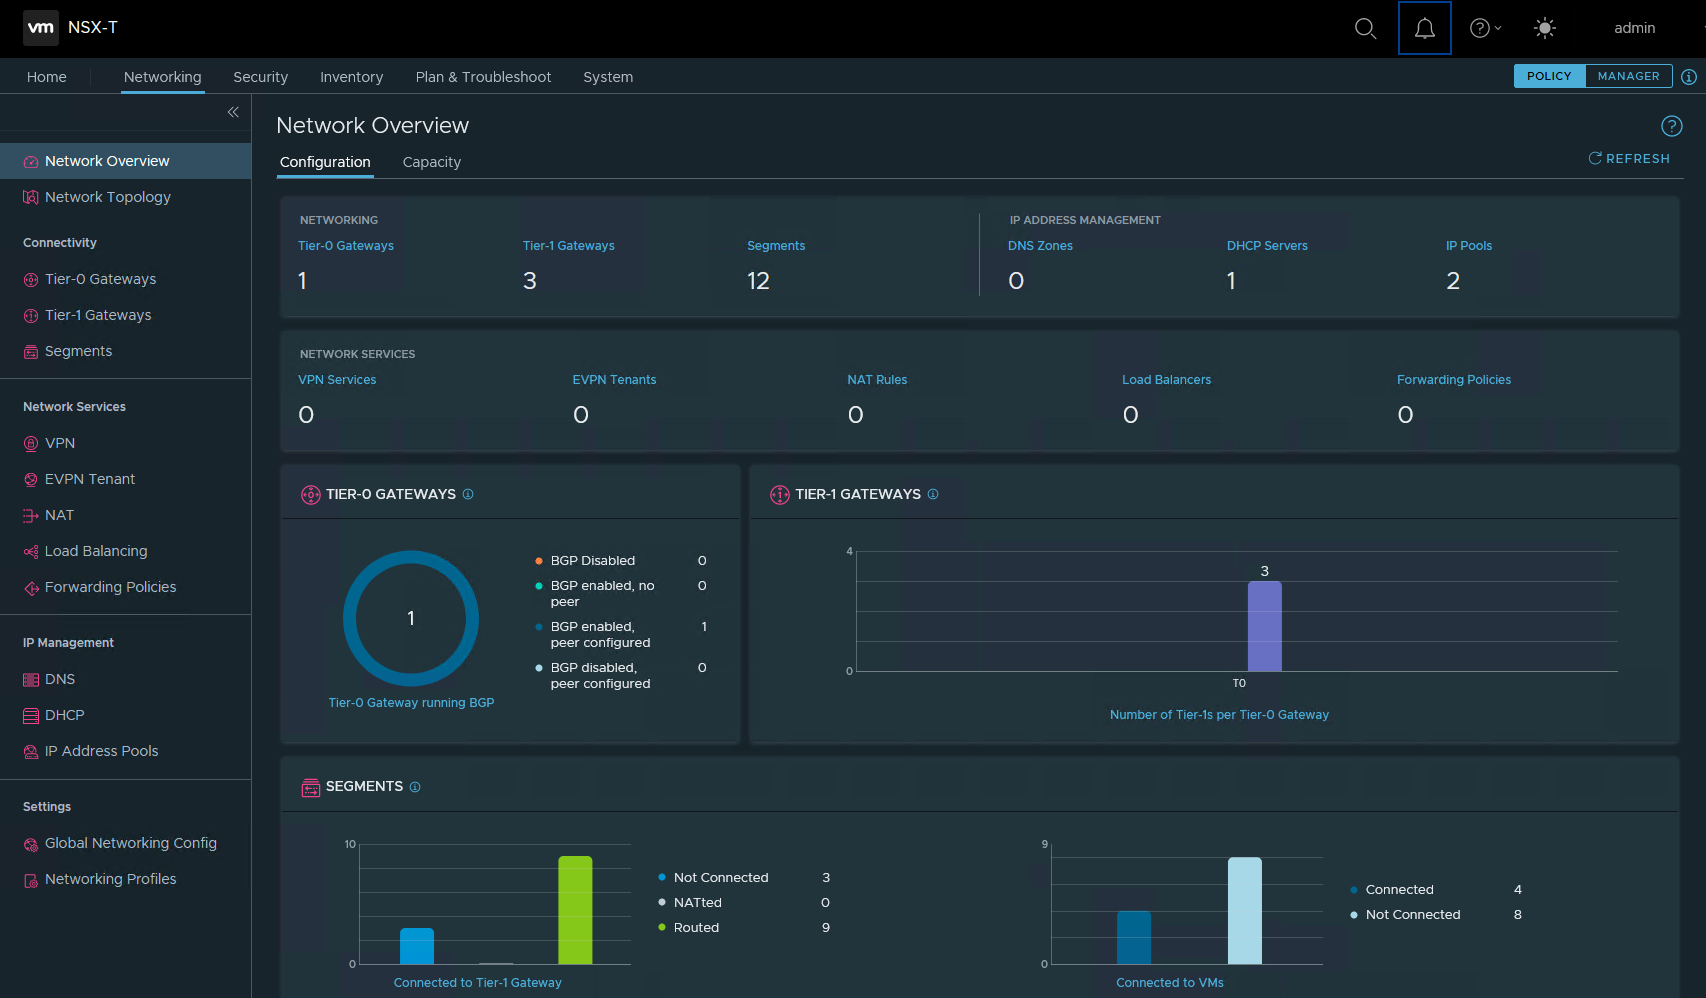
Doing a refresh on the UI shows everything back to normal.
Looking into it, there's an official VMware KB article discussing this issue, although it says it's fixed in NSX-T 3.1.2.1, but I'm on 3.1.3.0.